Stocks delivered another week of record gains in a shortened post-Memorial Day session, as sliding oil prices, chipmaker momentum, and growing confidence in a Middle East peace deal pushed all three major averages to new highs.
The Numbers
- S&P 500: +1.43%
- Nasdaq: +2.39%
- Dow Jones Industrial Average: +0.90%
- MSCI EAFE: +0.99%
The Nasdaq led for the week while the Dow made history, crossing 51,000 for the first time. The S&P 500’s ninth consecutive weekly gain extends one of the more remarkable winning streaks in recent memory.
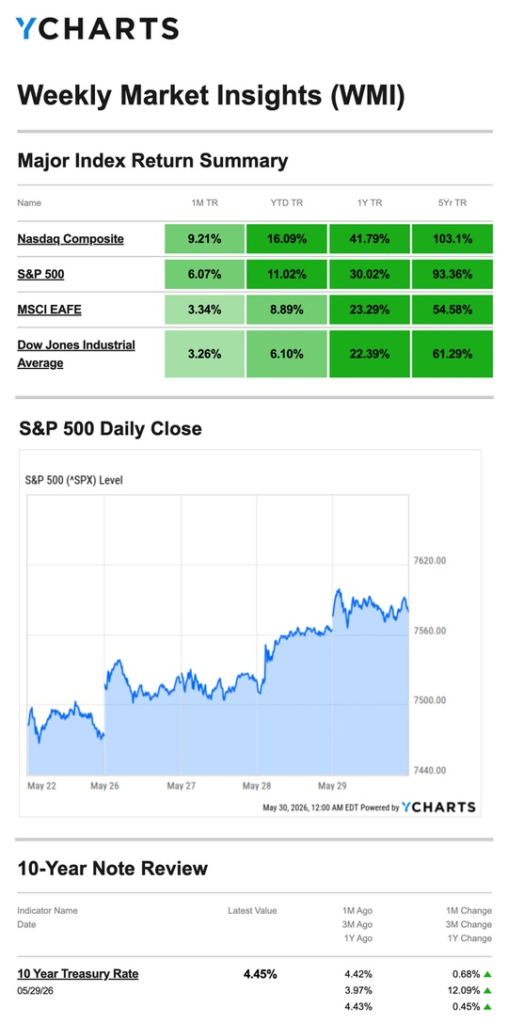
Source: YCharts.com, May 30, 2026. Weekly performance is measured from Friday, May 22, to Friday, May 29. TR = total return for the index, which includes any dividends and cash distributions during the period. Treasury note yield is expressed in basis points.
What Happened
Tuesday: Chips and Diplomacy Drive Early Gains
Stocks opened the shortened week on solid footing as the chipmaker-led rally continued to support broader market momentum. The White House reported diplomatic progress on a Middle East peace deal, adding an optimistic backdrop to an already constructive tape.
Wednesday: Dow Hits a New Record
Leadership rotated midweek, with the Dow rising modestly to a fresh record close as oil prices fell. The S&P and Nasdaq consolidated near their recent highs while the Dow took its turn leading.
Thursday: Upbeat Data Lifts S&P and Nasdaq
Both indexes opened higher on a slate of encouraging economic releases and posted solid gains through the session. The Dow went largely sideways as investors rotated toward growth and tech on the back of the data.
Friday: All Three Indexes Hit Records to Close the Month
Stocks wrapped up both the week and the month with broad gains. Falling oil prices and continued technology strength pushed all three major averages to record intraday and closing highs. The Dow crossed 51,000 for the first time, capping a strong May for U.S. equities.
The Data in Focus
Inflation: A Welcome Surprise
Thursday’s PCE index — the Fed’s preferred inflation gauge — rose 0.4% in April, slightly below the 0.5% economists had expected. Annual PCE came in at 3.8%. While still well above the Fed’s 2% target, a cooler-than-expected monthly reading is a step in the right direction and gave markets room to breathe heading into the weekend.
Growth: Revised Lower
Q1 GDP growth was revised down to 1.6% annualized, below the initial estimate. The downward revision reflects a softer economic foundation than the headline equity rally might suggest — a tension worth keeping in mind as markets push to new highs.
Manufacturing: A Standout Bright Spot
Durable goods orders surged 7.9% in April — double the expected pace and the largest monthly increase in nearly a year. The driver was striking: civilian aircraft orders soared 166% after China placed an order for 200 planes following the recent U.S.-China presidential summit. While the headline number is eye-catching, the aircraft orders are a one-time event and may not reflect broad manufacturing momentum. Underlying orders will be worth watching in coming months.
Housing: April Dips, But Context Matters
New home sales fell 6.2% in April from the prior month. Investors largely looked past the decline given that February and March posted gains of 8.9% and 7.4% respectively — suggesting April’s pullback follows two unusually strong months rather than signaling a trend reversal.
What We’re Watching
Friday’s Jobs Report
The May employment report is the week’s centerpiece. With the new Fed Chair signaling openness to a rate hike and inflation still running above target, the jobs number carries added weight. A strong reading reinforces the case for holding rates steady or moving higher; a weak one complicates the picture further.
PCE Trajectory
April’s cooler PCE print was encouraging, but annual inflation at 3.8% leaves the Fed with little room to declare victory. Whether May’s reading continues the softening trend will be a key input into Warsh’s first major policy decision as Fed Chair.
Peace Deal Progress
Nine weeks of gains have been built in part on the assumption that a Middle East resolution is coming. The White House’s diplomatic progress report this week was constructive — but until a deal is signed, oil markets and investor sentiment remain vulnerable to reversal on any negative headline.
This Week’s Critical Data
- Wednesday: ADP Employment Report; ISM Services; Fed Beige Book
- Friday: Federal Employment Report
Note: Investors Business Daily – Econoday economic calendar; May 29, 2026. Forecasts are subject to revision and may not materialize.
As always, if you have any questions about your portfolio or want to discuss your strategy, please don’t hesitate to reach out.

Crescent Private Wealth
Weekly Market Insights
Talk To Us!
Footnotes And Sources
WSJ.com, May 29, 2026
Investing.com, May 29, 2026
CNBC.com, May 26, 2026
CNBC.com, May 27, 2026
WSJ.com, May 28, 2026
CNBC.com, May 29, 2026
WSJ.com, May 28, 2026
KPMG.com, May 28, 2026
Realtor.com, May 28, 2026
Investing involves risks, and investment decisions should be based on your own goals, time horizon, and tolerance for risk. The return and principal value of investments will fluctuate as market conditions change. When sold, investments may be worth more or less than their original cost.
The forecasts or forward-looking statements are based on assumptions, may not materialize, and are subject to revision without notice.
The market indexes discussed are unmanaged, and generally, considered representative of their respective markets. Index performance is not indicative of the past performance of a particular investment. Indexes do not incur management fees, costs, and expenses. Individuals cannot directly invest in unmanaged indexes. Past performance does not guarantee future results.
The Dow Jones Industrial Average is an unmanaged index that is generally considered representative of large-capitalization companies on the U.S. stock market. The Nasdaq Composite is an index of the common stocks and similar securities listed on the Nasdaq stock market and considered a broad indicator of the performance of stocks of technology and growth companies. The MSCI EAFE Index was created by Morgan Stanley Capital International (MSCI) and serves as a benchmark of the performance of major international equity markets, as represented by 21 major MSCI indexes from Europe, Australia, and Southeast Asia. The S&P 500 Composite Index is an unmanaged group of securities that are considered to be representative of the stock market in general.
U.S. Treasury Notes are guaranteed by the federal government as to the timely payment of principal and interest. However, if you sell a Treasury Note prior to maturity, it may be worth more or less than the original price paid. Fixed income investments are subject to various risks including changes in interest rates, credit quality, inflation risk, market valuations, prepayments, corporate events, tax ramifications and other factors.
International investments carry additional risks, which include differences in financial reporting standards, currency exchange rates, political risks unique to a specific country, foreign taxes and regulations, and the potential for illiquid markets. These factors may result in greater share price volatility.


