Stocks ended mixed last week as a meaningful rotation out of technology and AI names pressured the broader market, while the Dow’s cyclical composition insulated it from the worst of the selling for a third consecutive weekly gain.
The Numbers
- S&P 500: −1.95%
- Nasdaq: −4.60%
- Dow Jones Industrial Average: +0.60%
- MSCI EAFE: −1.33%
The split between the Dow and Nasdaq — a 5.2 percentage point gap in weekly performance — is one of the widest divergences of the year. It reflects a market in active rotation rather than broad retreat, with investors moving capital rather than exiting equities entirely.
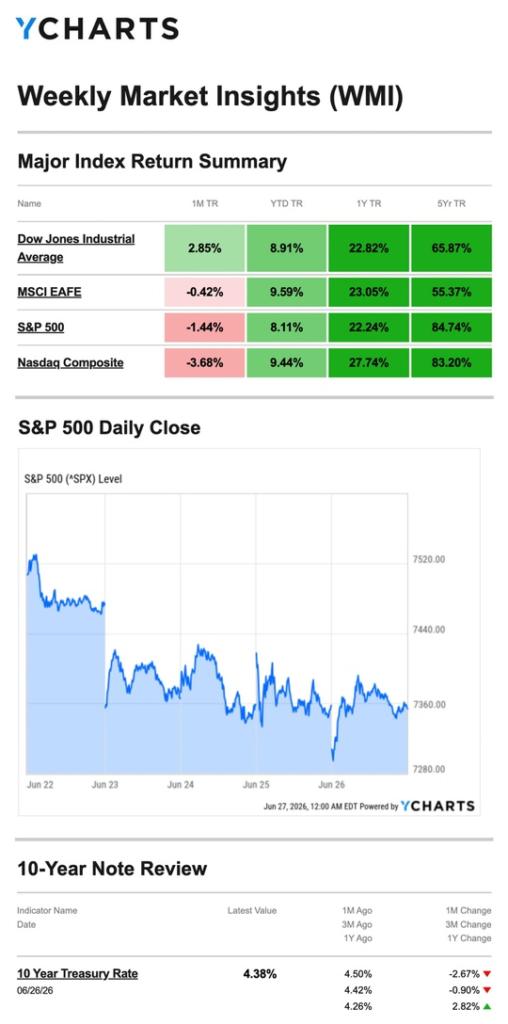
Source: YCharts.com, June 27, 2026. Weekly performance is measured from Monday, June 22, to Friday, June 26. TR = total return for the index, which includes any dividends and cash distributions during the period. Treasury note yield is expressed in basis points.
What Happened
Monday: Tech Selling Begins, Dow Holds
The S&P 500 and Nasdaq opened the week under pressure as investors took a closer look at AI valuations and began trimming tech exposure broadly. The Dow managed a modest gain, cushioned by its heavier weighting in financials, industrials, and consumer names.
Tuesday: Rotation Deepens
The shift away from tech accelerated on Tuesday. Large consumer stocks fared particularly well, limiting the Dow’s decline to a fraction of the broader market’s loss. The S&P fell roughly 1.4% on the day while the Nasdaq shed more than 2% — the week’s most pronounced single-day divergence.
Wednesday–Thursday: Slower Descent
Markets were mixed through the middle of the week. The healthcare, financial, and industrial sectors continued to drive the Dow to small gains on both days. Tech pressure persisted on the S&P and Nasdaq, though the pace of selling moderated compared to the start of the week.
Friday: Week Closes Quietly
Markets flattened out as the week wrapped up. The Dow logged its third consecutive weekly gain while the S&P and Nasdaq closed out a difficult week with little additional movement, the damage largely done by midweek.
Inflation: No Surprises, But No Relief Either
May’s PCE index — the Fed’s preferred inflation gauge — came in as expected, and markets were visibly relieved that there were no upside surprises following weeks of elevated readings. However, the details warrant attention. Core PCE, which strips out energy and food prices, reached its highest level since October 2023. That means underlying inflation, separate from the energy shock driven by the Middle East conflict, is quietly drifting higher.
For the Fed, a PCE reading that matches expectations is better than a miss, but it does not resolve the core inflation challenge. Chair Warsh has signaled patience for now, but core inflation at a nearly three-year high keeps the rate hike conversation very much alive heading into the second half of 2026.
What We’re Watching
Thursday’s Jobs Report
The June employment report is the week’s centerpiece and arrives on Thursday rather than the usual Friday. Two consecutive months of stronger-than-expected job growth have already complicated the Fed’s calculus. A third would further cement the case for a rate hike later this year. A softer reading would give the Fed — and markets — more breathing room.
The AI Valuation Question
Last week’s selloff was not driven by a single negative earnings report or macro shock — it reflected a broader investor reckoning with whether AI-related valuations have run ahead of fundamentals. This theme has surfaced several times this year and tends to resolve in one of two ways: either earnings catch up to valuations, or prices correct further to meet them. Upcoming earnings reports from major AI names will be the next major test.
Rotation as a Market Signal
Three weeks of Dow outperformance relative to the Nasdaq suggest the rotation into cyclicals, financials, and industrials has real staying power. If the jobs report comes in strong and rate hike expectations firm up, that rotation could accelerate — rewarding value-oriented and dividend-paying holdings while putting further pressure on high-multiple growth stocks.
This Week’s Critical Data
- Wednesday: ADP Employment Report; ISM Manufacturing
- Thursday: June Employment Report; Weekly Jobless Claims
Source: Investors Business Daily – Econoday economic calendar; June 26, 2026. Forecasts are subject to revision and may not materialize.
As always, if you have any questions about your portfolio or want to discuss your strategy, please don’t hesitate to reach out.

Crescent Private Wealth
Weekly Market Insights
Talk To Us!
Footnotes And Sources
WSJ.com, June 26, 2026
Investing.com, June 26, 2026
CNBC.com, June 22, 2026
CNBC.com, June 23, 2026
CNBC.com, June 24, 2026
CNBC.com, June 25, 2026
WSJ.com, June 26, 2026
CNBC.com, June 25, 2026
Investing involves risks, and investment decisions should be based on your own goals, time horizon, and tolerance for risk. The return and principal value of investments will fluctuate as market conditions change. When sold, investments may be worth more or less than their original cost.
The forecasts or forward-looking statements are based on assumptions, may not materialize, and are subject to revision without notice.
The market indexes discussed are unmanaged, and generally, considered representative of their respective markets. Index performance is not indicative of the past performance of a particular investment. Indexes do not incur management fees, costs, and expenses. Individuals cannot directly invest in unmanaged indexes. Past performance does not guarantee future results.
The Dow Jones Industrial Average is an unmanaged index that is generally considered representative of large-capitalization companies on the U.S. stock market. The Nasdaq Composite is an index of the common stocks and similar securities listed on the Nasdaq stock market and considered a broad indicator of the performance of stocks of technology and growth companies. The MSCI EAFE Index was created by Morgan Stanley Capital International (MSCI) and serves as a benchmark of the performance of major international equity markets, as represented by 21 major MSCI indexes from Europe, Australia, and Southeast Asia. The S&P 500 Composite Index is an unmanaged group of securities that are considered to be representative of the stock market in general.
U.S. Treasury Notes are guaranteed by the federal government as to the timely payment of principal and interest. However, if you sell a Treasury Note prior to maturity, it may be worth more or less than the original price paid. Fixed income investments are subject to various risks including changes in interest rates, credit quality, inflation risk, market valuations, prepayments, corporate events, tax ramifications and other factors.
International investments carry additional risks, which include differences in financial reporting standards, currency exchange rates, political risks unique to a specific country, foreign taxes and regulations, and the potential for illiquid markets. These factors may result in greater share price volatility.


