Stocks fell last week amid competing narratives: the best inflation news in years arrived midweek, but a deepening selloff in chip stocks and tech overwhelmed the positive data, pushing all four indexes lower.
The Numbers
- S&P 500: −1.55%
- Nasdaq: −2.90%
- Dow Jones Industrial Average: −0.93%
- MSCI EAFE: −0.80%
Losses were broad but tech-led, with the Nasdaq bearing the heaviest burden. The week’s outcome is particularly striking, given that it included the most encouraging inflation data since the Middle East conflict began.
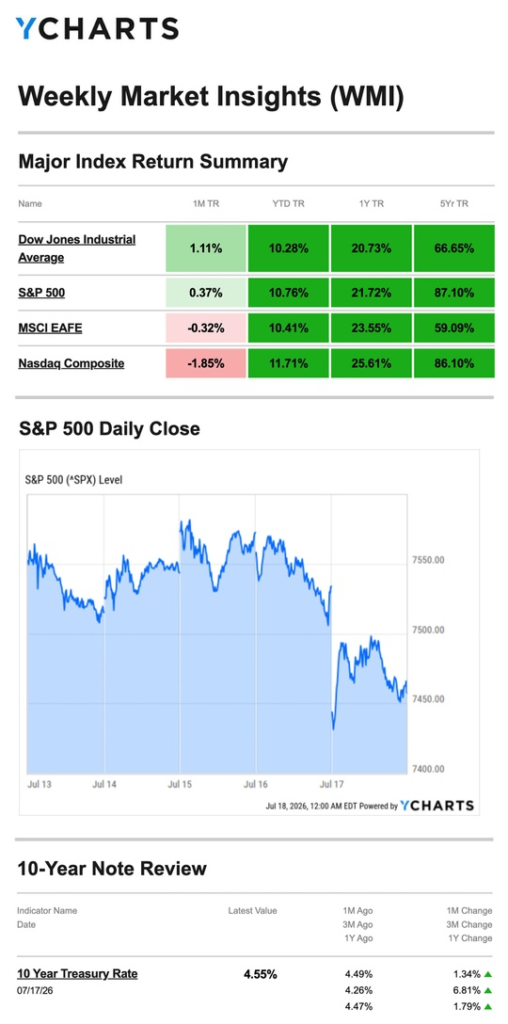
Source: YCharts.com, July 18, 2026. Weekly performance is measured from Monday, July 13, to Friday, July 17. TR = total return for the index, which includes any dividends and cash distributions during the period. Treasury note yield is expressed in basis points.
What Happened
Monday: Conflict Tensions Reopen
Renewed Middle East tensions gripped markets at the open. Oil prices climbed and stocks fell broadly, reversing some of the optimism that had built following the initial peace agreement announcement. The week’s difficult start set the stage for an unusual midweek split between macro good news and sector-specific selling.
Tuesday: Consumer Inflation Falls for First Time Since 2020
Investors cheered Tuesday after the June CPI report showed consumer prices fell 0.4% month-over-month — the first monthly decline in consumer inflation since April 2020 and the first such drop in six years. The news lifted sentiment and offered the clearest sign yet that the energy-driven inflation spike may be unwinding.
Wednesday: Wholesale Inflation Drops, Fed Language Shifts
The positive inflation story continued on Wednesday when the Producer Price Index showed wholesale prices unexpectedly declined 0.3% in June. Later that day, New York Fed President John Williams stated his belief that inflation had likely peaked — a notable shift in language from a senior Fed official. Markets digested both developments constructively, though chip stocks were already weighing on the indexes.
Thursday–Friday: Chips Lead the Selloff
Semiconductor stocks dragged the broader market lower Thursday, and the selling accelerated Friday. The S&P lost more than 1%, and the Nasdaq fell 1.4% on the final session as investors rotated out of chip stocks and other tech names into other sectors. The rotation dynamic that has defined much of the past month reasserted itself with force to close the week.
Inflation: A Genuine Turning Point
Last week’s inflation data deserves to be understood for what it is — not just another monthly data point, but a potential inflection.
June CPI falling 0.4% month-over-month is the first outright monthly decline in consumer prices since April 2020. Combined with a surprise drop in wholesale prices and a senior Fed official stating that inflation has likely peaked, the data collectively suggest the energy-driven price spike triggered by the Strait of Hormuz disruption is beginning to reverse. Annual CPI will take longer to reflect the improvement, given how elevated readings were in earlier months, but the direction of travel has shifted.
For the Fed, this changes the calculus meaningfully. A divided central bank that was seriously debating rate hikes just two weeks ago now has new data supporting a hold — or potentially the beginning of a conversation about cuts later in the year. Chair Warsh’s response to this data will be closely watched.
What We’re Watching
he Chip Stock Rotation
Semiconductors led markets higher for much of the past three months, and they are now leading the selloff. The AI trade that drove the Nasdaq’s outperformance is under pressure from two directions: valuation concerns that have been building for weeks, and a rotation toward sectors that benefit more directly from falling inflation and lower rate expectations. How chip stocks respond to this week’s earnings reports from major tech companies will be telling.
What Falling Inflation Means for Rates
If inflation has genuinely peaked, the Fed’s most urgent pressure to hike rates diminishes considerably. Markets will be repricing rate expectations throughout this week, and the Fed’s closed Board of Governors meeting on Monday adds a layer of intrigue. Any signal that the internal “family fight” is resolving toward patience rather than tightening would be a meaningful catalyst for a tech recovery.
A Light Data Week
This week’s economic calendar is relatively quiet, with Friday’s PMI readings and new home sales as the most-watched releases. That puts chip stock earnings and any Fed commentary in the driver’s seat as the primary market catalysts.
This Week’s Critical Data
- Thursday: Weekly Jobless Claims
- Friday: PMI — Manufacturing and Services; New Home Sales
Source: Investors Business Daily – Econoday economic calendar; July 17, 2026. Forecasts are subject to revision and may not materialize.
As always, if you have any questions about your portfolio or want to discuss your strategy, please don’t hesitate to reach out.

Crescent Private Wealth
Weekly Market Insights
Talk To Us!
Footnotes And Sources
WSJ.com, July 17, 2026
Investing.com, July 17, 2026
CNBC.com, July 13, 2026
WSJ.com, July 14, 2026
CNBC.com, July 15, 2026
CNBC.com, July 16, 2026
CNBC.com, July 17, 2026
CNBC.com, July 14, 2026
CNBC.com, July 15, 2026
Investing involves risks, and investment decisions should be based on your own goals, time horizon, and tolerance for risk. The return and principal value of investments will fluctuate as market conditions change. When sold, investments may be worth more or less than their original cost.
The forecasts or forward-looking statements are based on assumptions, may not materialize, and are subject to revision without notice.
The market indexes discussed are unmanaged, and generally, considered representative of their respective markets. Index performance is not indicative of the past performance of a particular investment. Indexes do not incur management fees, costs, and expenses. Individuals cannot directly invest in unmanaged indexes. Past performance does not guarantee future results.
The Dow Jones Industrial Average is an unmanaged index that is generally considered representative of large-capitalization companies on the U.S. stock market. The Nasdaq Composite is an index of the common stocks and similar securities listed on the Nasdaq stock market and considered a broad indicator of the performance of stocks of technology and growth companies. The MSCI EAFE Index was created by Morgan Stanley Capital International (MSCI) and serves as a benchmark of the performance of major international equity markets, as represented by 21 major MSCI indexes from Europe, Australia, and Southeast Asia. The S&P 500 Composite Index is an unmanaged group of securities that are considered to be representative of the stock market in general.
U.S. Treasury Notes are guaranteed by the federal government as to the timely payment of principal and interest. However, if you sell a Treasury Note prior to maturity, it may be worth more or less than the original price paid. Fixed income investments are subject to various risks including changes in interest rates, credit quality, inflation risk, market valuations, prepayments, corporate events, tax ramifications and other factors.
International investments carry additional risks, which include differences in financial reporting standards, currency exchange rates, political risks unique to a specific country, foreign taxes and regulations, and the potential for illiquid markets. These factors may result in greater share price volatility.