Markets rallied last week, with the S&P 500 up 1.57% and the Dow posting its best week in months, gaining 2.32%. Here’s what drove the move and what to watch this week.
The Numbers
- S&P 500: +1.57%
- Nasdaq: +1.88%
- Dow: +2.32%
- MSCI EAFE: +1.41%
Strong performance across the board, driven by a mix of bullish sentiment, rotating sector momentum, and a softer-than-expected jobs report that investors interpreted as Fed-friendly.
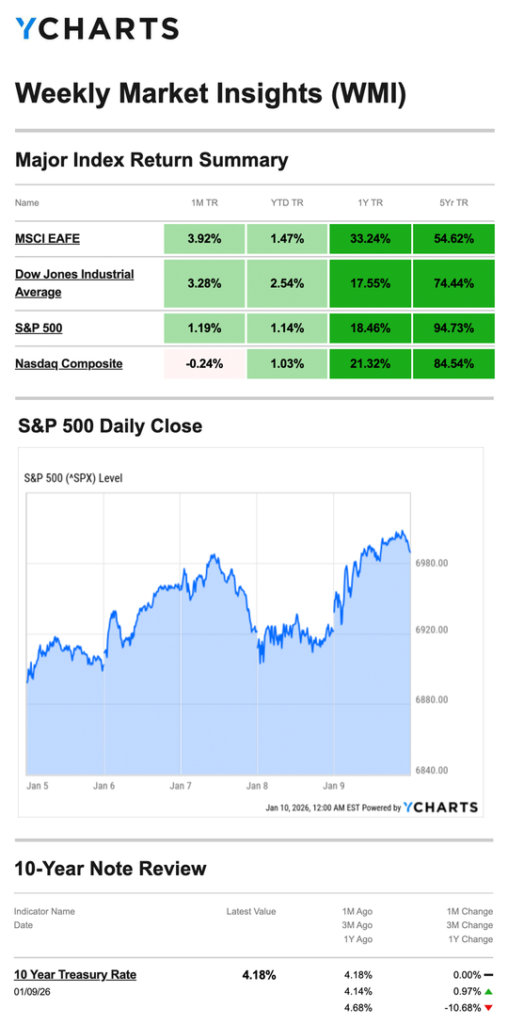
Source: YCharts.com, January 10, 2026. Weekly performance is measured from Monday, January 5, to Friday, January 9. TR = total return for the index, which includes any dividends as well as any other cash distributions during the period. Treasury note yield is expressed in basis points.
What Happened
Early Week: Rally Momentum
The Dow finally delivered its “Santa Rally,” gaining 1.1% over the seven-session period. By Tuesday, AI chip stocks drove all three indexes higher. The Dow crossed 49,000 for the first time, with both the S&P 500 and Dow hitting record closes.
Mid-Week: Sector Rotation
Then investors started rotating out of tech into cyclicals—industrials, defense, financials. Defense stocks got a boost from news of a proposed $1.5 trillion defense budget for 2027. The Dow, weighted more toward these sectors, pulled ahead.
Friday: Jobs Report
December employment showed 50,000 net new jobs (below 73,000 expected). Unemployment ticked down to 4.4%.
Context: Full-year job growth averaged just 49,000 per month—the slowest pace in 22 years. Federal job cuts (277,000 positions eliminated) drove much of the weakness.
Markets rallied on this news. Why? Weaker job growth gives the Fed flexibility on rates at their January meeting.
What We’re Watching
Sector Rotation: The move from tech to cyclicals could signal a shift in market leadership. For diversified portfolios, this rotation validates the structure—you’re not overconcentrated in any single sector.
Labor Market: Job growth at 49,000 per month is historically weak. The Fed will watch whether this is an orderly slowdown or something accelerating.
This Week’s Critical Data: CPI drops Tuesday. That’s the report that matters. If inflation comes in hot, last week’s rally reverses quickly.
* indicates publication of a report delayed by the government shutdown in October and November
Source: Investors Business Daily – Econoday economic calendar; January 9, 2026. The Econoday economic calendar lists upcoming U.S. economic data releases (including key economic indicators), Federal Reserve policy meetings, and speaking engagements of Federal Reserve officials. The content is developed from sources believed to provide accurate information. The forecasts or forward-looking statements are based on assumptions and may not materialize. The forecasts are also subject to revision.
As always, if you have any questions about your portfolio or want to discuss your strategy, please don’t hesitate to reach out.

Crescent Private Wealth
Weekly Market Insights
Talk To Us!
Footnotes And Sources
1 .WSJ.com, January 2, 2026
2. Investing.com, January 2, 2026
3. CNBC.com, December 29, 2025
4. WSJ.com, December 30, 2025
5. CNBC.com, December 31, 2025
6. CNBC.com, January 2, 2026
7. CNBC.com, December 30, 2025
Investing involves risks, and investment decisions should be based on your own goals, time horizon, and tolerance for risk. The return and principal value of investments will fluctuate as market conditions change. When sold, investments may be worth more or less than their original cost.
The forecasts or forward-looking statements are based on assumptions, may not materialize, and are subject to revision without notice.
The market indexes discussed are unmanaged, and generally, considered representative of their respective markets. Index performance is not indicative of the past performance of a particular investment. Indexes do not incur management fees, costs, and expenses. Individuals cannot directly invest in unmanaged indexes. Past performance does not guarantee future results.
The Dow Jones Industrial Average is an unmanaged index that is generally considered representative of large-capitalization companies on the U.S. stock market. The Nasdaq Composite is an index of the common stocks and similar securities listed on the Nasdaq stock market and considered a broad indicator of the performance of stocks of technology and growth companies. The MSCI EAFE Index was created by Morgan Stanley Capital International (MSCI) and serves as a benchmark of the performance of major international equity markets, as represented by 21 major MSCI indexes from Europe, Australia, and Southeast Asia. The S&P 500 Composite Index is an unmanaged group of securities that are considered to be representative of the stock market in general.
U.S. Treasury Notes are guaranteed by the federal government as to the timely payment of principal and interest. However, if you sell a Treasury Note prior to maturity, it may be worth more or less than the original price paid. Fixed income investments are subject to various risks including changes in interest rates, credit quality, inflation risk, market valuations, prepayments, corporate events, tax ramifications and other factors.
International investments carry additional risks, which include differences in financial reporting standards, currency exchange rates, political risks unique to a specific country, foreign taxes and regulations, and the potential for illiquid markets. These factors may result in greater share price volatility.