Hope prevailed over fear last week as investors embraced ceasefire optimism and the prospect of the Strait of Hormuz reopening — pushing stocks to their second consecutive week of strong gains despite a two-year high in headline inflation.
The Numbers
- S&P 500: +3.56%
- Nasdaq: +4.68%
- Dow Jones Industrial Average: +3.04%
- MSCI EAFE: +4.52%
Gains were broad and robust across all four indexes, with international developed markets keeping pace with the Nasdaq for the week. The Dow turned positive for the year by Thursday — a notable milestone after five weeks of losses.
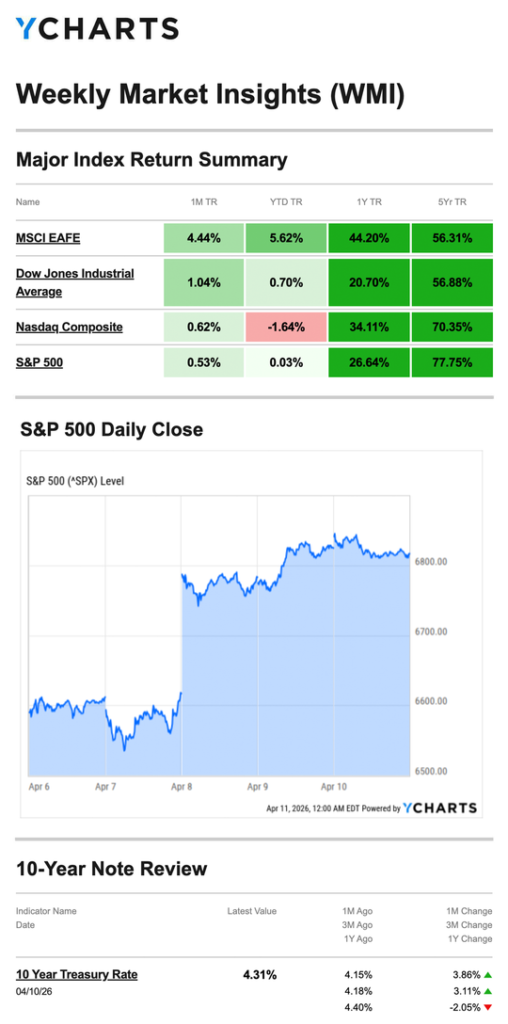
Source: YCharts.com, April 11, 2026. Weekly performance is measured from Monday, April 6, to Friday, April 10. TR = total return for the index, which includes any dividends and cash distributions during the period. Treasury note yield is expressed in basis points.
What Happened
Monday: Four-Day Win Streak Continues Stocks opened to modest gains, extending the S&P 500’s winning streak to four consecutive sessions. Markets kept a watchful eye on the U.S.-imposed April 7 deadline for Iran to allow free passage of oil and commerce through the Strait of Hormuz — or face further strikes on its energy infrastructure.
Tuesday: Deadline Extended, Relief Returns Stocks opened lower before recovering late in the session on news that Pakistan had asked the U.S. to push the deadline back by two weeks. The extension reduced the immediate risk of escalation and gave diplomacy more room to work.
Wednesday: Suspension Announced, Markets Surge The week’s defining moment arrived Wednesday when the White House announced it was suspending strikes for two weeks while considering a formal ceasefire proposal. All three major averages gained more than 2.5% on the day alone, led by tech stocks. It was one of the strongest single-day performances of the year.
Thursday–Friday: Rally Holds, Inflation Shrugged Off The relief rally carried through Thursday, lifting the Dow back into positive territory for 2026. On Friday, markets absorbed a headline inflation reading that hit a two-year high and a disappointing consumer sentiment report — and largely looked past both, closing the week near its highs.
Inflation: Headline vs. Core Friday’s CPI report deserves more than a passing glance, even if markets chose to move on quickly.
Headline inflation — the overall rate — rose to 3.8% year-over-year in March, up sharply from 2.4% in February and the highest reading since April 2024. That sounds alarming. But the driver was a 21% spike in gasoline prices, a direct consequence of the Strait of Hormuz disruption that investors had largely anticipated.
Strip out energy and food prices and the picture looks different: core inflation came in at 2.7% year-over-year, slightly below expectations. That distinction is why markets were largely unfazed. Investors are treating the energy-driven spike as a temporary, conflict-related phenomenon rather than a sign of broadening price pressure — for now. If the ceasefire holds and oil prices normalize, headline inflation should recede. If it doesn’t, that calculus changes quickly.
What We’re Watching
Whether the Ceasefire Holds The two-week suspension of strikes is a meaningful de-escalation, but it is not a resolution. The next two weeks will be critical in determining whether this becomes a durable ceasefire or another false dawn. Markets are currently pricing in the optimistic scenario — which means any setback could be felt quickly.
The Fed’s Next Read With headline inflation at a two-year high and core holding relatively steady, the Fed faces a delicate communications challenge. A heavy schedule of Fed official speeches this week — including multiple governors and several regional presidents — will be closely monitored for any shift in tone around rate policy. The Beige Book on Wednesday adds further texture.
Tuesday’s PPI The Producer Price Index arrives Tuesday and will offer the first wholesale inflation read since the conflict began showing signs of easing. A cooler number would reinforce the narrative that energy-driven inflation is transitory; a hot reading would complicate it.
This Week’s Critical Data
- Tuesday: Producer Price Index (PPI)
- Wednesday: Fed Beige Book
- Thursday: Weekly Jobless Claims; Industrial Production
Source: Investors Business Daily – Econoday economic calendar; April 10, 2026. Forecasts are subject to revision and may not materialize.
As always, if you have any questions about your portfolio or want to discuss your strategy, please don’t hesitate to reach out.

Crescent Private Wealth
Weekly Market Insights
Talk To Us!
Footnotes And Sources
WSJ.com, April 10, 2026
Investing.com, April 10, 2026
CNBC.com, April 6, 2026
CNBC.com, April 7, 2026
CNBC.com, April 8, 2026
WSJ.com, April 9, 2026
WSJ.com, April 10, 2026
CNBC.com, April 10, 2026
IRS.gov, September 16, 2025
Investing involves risks, and investment decisions should be based on your own goals, time horizon, and tolerance for risk. The return and principal value of investments will fluctuate as market conditions change. When sold, investments may be worth more or less than their original cost.
The forecasts or forward-looking statements are based on assumptions, may not materialize, and are subject to revision without notice.
The market indexes discussed are unmanaged, and generally, considered representative of their respective markets. Index performance is not indicative of the past performance of a particular investment. Indexes do not incur management fees, costs, and expenses. Individuals cannot directly invest in unmanaged indexes. Past performance does not guarantee future results.
The Dow Jones Industrial Average is an unmanaged index that is generally considered representative of large-capitalization companies on the U.S. stock market. The Nasdaq Composite is an index of the common stocks and similar securities listed on the Nasdaq stock market and considered a broad indicator of the performance of stocks of technology and growth companies. The MSCI EAFE Index was created by Morgan Stanley Capital International (MSCI) and serves as a benchmark of the performance of major international equity markets, as represented by 21 major MSCI indexes from Europe, Australia, and Southeast Asia. The S&P 500 Composite Index is an unmanaged group of securities that are considered to be representative of the stock market in general.
U.S. Treasury Notes are guaranteed by the federal government as to the timely payment of principal and interest. However, if you sell a Treasury Note prior to maturity, it may be worth more or less than the original price paid. Fixed income investments are subject to various risks including changes in interest rates, credit quality, inflation risk, market valuations, prepayments, corporate events, tax ramifications and other factors.
International investments carry additional risks, which include differences in financial reporting standards, currency exchange rates, political risks unique to a specific country, foreign taxes and regulations, and the potential for illiquid markets. These factors may result in greater share price volatility.