Stocks were essentially flat last week as new record highs and continued chipmaker momentum collided with the hottest inflation readings in years, leaving investors uncertain whether the six-week rally can sustain itself in a higher-price environment.
The Numbers
- S&P 500: +0.13%
- Nasdaq: −0.08%
- Dow Jones Industrial Average: −0.17%
- MSCI EAFE: −1.77%
A week of dramatic intraweek swings resolved into near-zero net movement for U.S. indexes — masking real volatility beneath the surface. International developed markets pulled back more meaningfully, reflecting broader unease about energy-driven inflation globally.
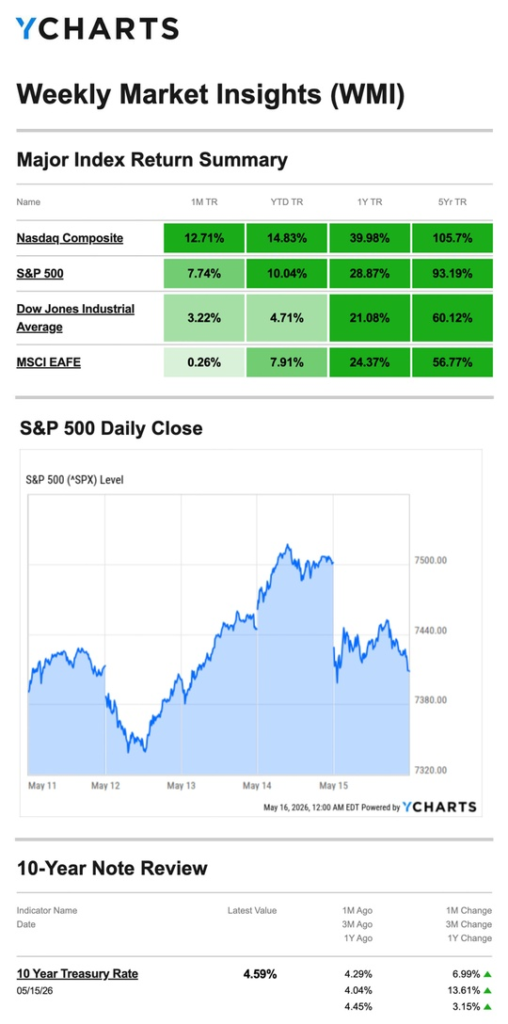
Source: YCharts.com, May 16, 2026. Weekly performance is measured from Monday, May 11, to Friday, May 15. TR = total return for the index, which includes any dividends and cash distributions during the period. Treasury note yield is expressed in basis points.
What Happened
Monday: Records Continue
Stocks opened the week on a firm footing, with the S&P 500 closing above 7,400 for the first time and the Nasdaq notching another record close. Chipmaker stocks continued to lead the tech sector higher.
Tuesday: CPI Hits, Markets Wobble
Markets opened lower after April’s Consumer Price Index came in hotter than expected. Stocks recovered through the session, with the Dow managing a slight gain by the close, but the inflation report cast a shadow over the week’s narrative.
Wednesday–Thursday: Rally Resumes, More Records Fall
Markets pushed higher over the next two sessions, with the S&P 500 and Nasdaq hitting fresh intraday and closing records. A strong Q1 report from a megacap technology company paced Thursday’s gains while investors monitored an ongoing U.S.-China summit. The S&P 500 closed above 7,500 for the first time; the Dow reclaimed 50,000.
Friday: Disappointment Closes the Week
Stocks fell from the opening bell as Treasury yields rose and the three-day U.S.-China summit concluded without major agreements, particularly on the Middle East conflict. The lack of a breakthrough deflated sentiment that had been building through midweek.
Inflation: The Numbers Are Hard to Ignore
Last week, the data on inflation was the most concerning in several months. The details deserve a closer look.
Consumer prices rose 3.8% year-over-year in April, up from 3.3% in March. Energy drove the bulk of the increase: fuel oil climbed 54% year-over-year, and gasoline surged 28%. More than 40% of the month-over-month gain of 0.6% was attributable to energy inflation alone. It is a potential consequence of the ongoing disruption in the Strait of Hormuz.
Wholesale inflation told a similar story. The Producer Price Index rose 6% year-over-year in April — a three-year high — while the month-over-month gain of 1.4% was a four-year high, far exceeding the 0.5% economists had expected.
The critical question is whether this remains an energy-driven, conflict-specific phenomenon or is beginning to broaden into other categories. If the ceasefire holds and oil normalizes, these readings may prove temporary. If energy prices stay elevated, the Fed will face mounting pressure to respond, even in a slowing economy.
What We’re Watching
The Fed’s Next Move
Wednesday’s release of May FOMC meeting minutes will be the week’s most closely watched event. With both CPI and PPI now running well above target, markets will be parsing every word for signals about whether the Fed is shifting toward a more hawkish posture under new Chair Warsh or holding its current wait-and-see stance.
Inflation’s Broadening Risk
Energy-driven inflation is easier for the Fed to look past than broad-based price increases. This week’s PMI data on Thursday will offer an early read on whether businesses are experiencing wider cost pressures beyond energy. It is a key variable in determining how long the current inflation spike lasts.
U.S.-China Relations
The summit concluded without headline agreements, but the conversations themselves may lay the groundwork for future developments. Any progress on Middle East diplomacy involving Chinese mediation, or any deterioration in the bilateral relationship that could move markets quickly, given how sensitive oil prices remain to developments in the region.
This Week’s Critical Data
- Wednesday: FOMC Meeting Minutes (May)
- Thursday: Weekly Jobless Claims; PMI — Manufacturing and Services
- Friday: Consumer Sentiment; Leading Economic Indicators
Note: Some releases this week reflect data delayed by last year’s government shutdown. Source: Investors Business Daily – Econoday economic calendar; May 15, 2026. Forecasts are subject to revision and may not materialize.
As always, if you have any questions about your portfolio or want to discuss your strategy, please don’t hesitate to reach out.

Crescent Private Wealth
Weekly Market Insights
Talk To Us!
Footnotes And Sources
WSJ.com, May 15, 2026
Investing.com, May 15, 2026
CNBC.com, May 11, 2026
WSJ.com, May 12, 2026
CNBC.com, May 13, 2026
CNBC.com, May 14, 2026
CNBC.com, May 15, 2026
WSJ.com, May 12, 2026
CNBC.com, May 13, 2026
IRS.gov, November 3, 2025
Investing involves risks, and investment decisions should be based on your own goals, time horizon, and tolerance for risk. The return and principal value of investments will fluctuate as market conditions change. When sold, investments may be worth more or less than their original cost.
The forecasts or forward-looking statements are based on assumptions, may not materialize, and are subject to revision without notice.
The market indexes discussed are unmanaged, and generally, considered representative of their respective markets. Index performance is not indicative of the past performance of a particular investment. Indexes do not incur management fees, costs, and expenses. Individuals cannot directly invest in unmanaged indexes. Past performance does not guarantee future results.
The Dow Jones Industrial Average is an unmanaged index that is generally considered representative of large-capitalization companies on the U.S. stock market. The Nasdaq Composite is an index of the common stocks and similar securities listed on the Nasdaq stock market and considered a broad indicator of the performance of stocks of technology and growth companies. The MSCI EAFE Index was created by Morgan Stanley Capital International (MSCI) and serves as a benchmark of the performance of major international equity markets, as represented by 21 major MSCI indexes from Europe, Australia, and Southeast Asia. The S&P 500 Composite Index is an unmanaged group of securities that are considered to be representative of the stock market in general.
U.S. Treasury Notes are guaranteed by the federal government as to the timely payment of principal and interest. However, if you sell a Treasury Note prior to maturity, it may be worth more or less than the original price paid. Fixed income investments are subject to various risks including changes in interest rates, credit quality, inflation risk, market valuations, prepayments, corporate events, tax ramifications and other factors.
International investments carry additional risks, which include differences in financial reporting standards, currency exchange rates, political risks unique to a specific country, foreign taxes and regulations, and the potential for illiquid markets. These factors may result in greater share price volatility.


